Example usage
Note
Ensure that your Python virtual environment is activated before running any of the commands below. Otherwise, the executables and dependencies of the APyT package may not be found.
If you followed the installation instructions, a small
example dataset, apyt_W_calibration_tap_01_trimmed.raw, is automatically
installed in your virtual environment. The easiest way to access this file is to
copy it to your current working directory using the following Python one-liner:
python3 -c "from importlib.resources import files; from shutil import copy; copy(files('data').joinpath('apyt_W_calibration_tap_01_trimmed.raw'), '.')"
Hint
To use the default configuration (recommended for testing), APyT expects the following directory structure and file locations within your home directory:
Linux / macOS:
/home/<user>/APyT/db.yaml
/home/<user>/APyT/data/<measurement_files>
Windows:
C:\Users\<user>\APyT\db.yaml
C:\Users\<user>\APyT\data\<measurement_files>
These locations can be customized in the global configuration file, but the defaults are recommended for first-time use and testing.
Next, prepare your local YAML database file and save it
as db.yaml in the path shown above:
1:
  custom_id: W_calibration_tap_01_trimmed
  device: tap
  file: apyt_W_calibration_tap_01_trimmed.raw
  parameters: {}
Ensure that the apyt_W_calibration_tap_01_trimmed.raw file you copied
earlier is placed in the data directory specified above.
Note
Before proceeding, it is recommended to review the documentation for the command-line interface to familiarize yourself with the available commands and options.
You can now perform the mass spectrum alignment using the
apyt_spectrum_align command-line tool:
apyt_spectrum_align --no-sql 1
Hint
If any configuration setting is incorrect, the command line will display a warning or error message describing the issue and the expected setup. If you followed the default configuration, the command should run without errors.
Running this command loads the example dataset from your local database and opens the graphical interface for spectrum alignment.
Attention
The exemplary dataset contains only 100,000 events, which is significantly smaller than a typical measurement. As a result, some APyT automation routines may not perform optimally due to higher statistical noise. It is intended primarily for testing and familiarization with the workflow.
Hint
The figure below shows a suitable choice for alignment parameters using the various text fields and sliders in the graphical interface.
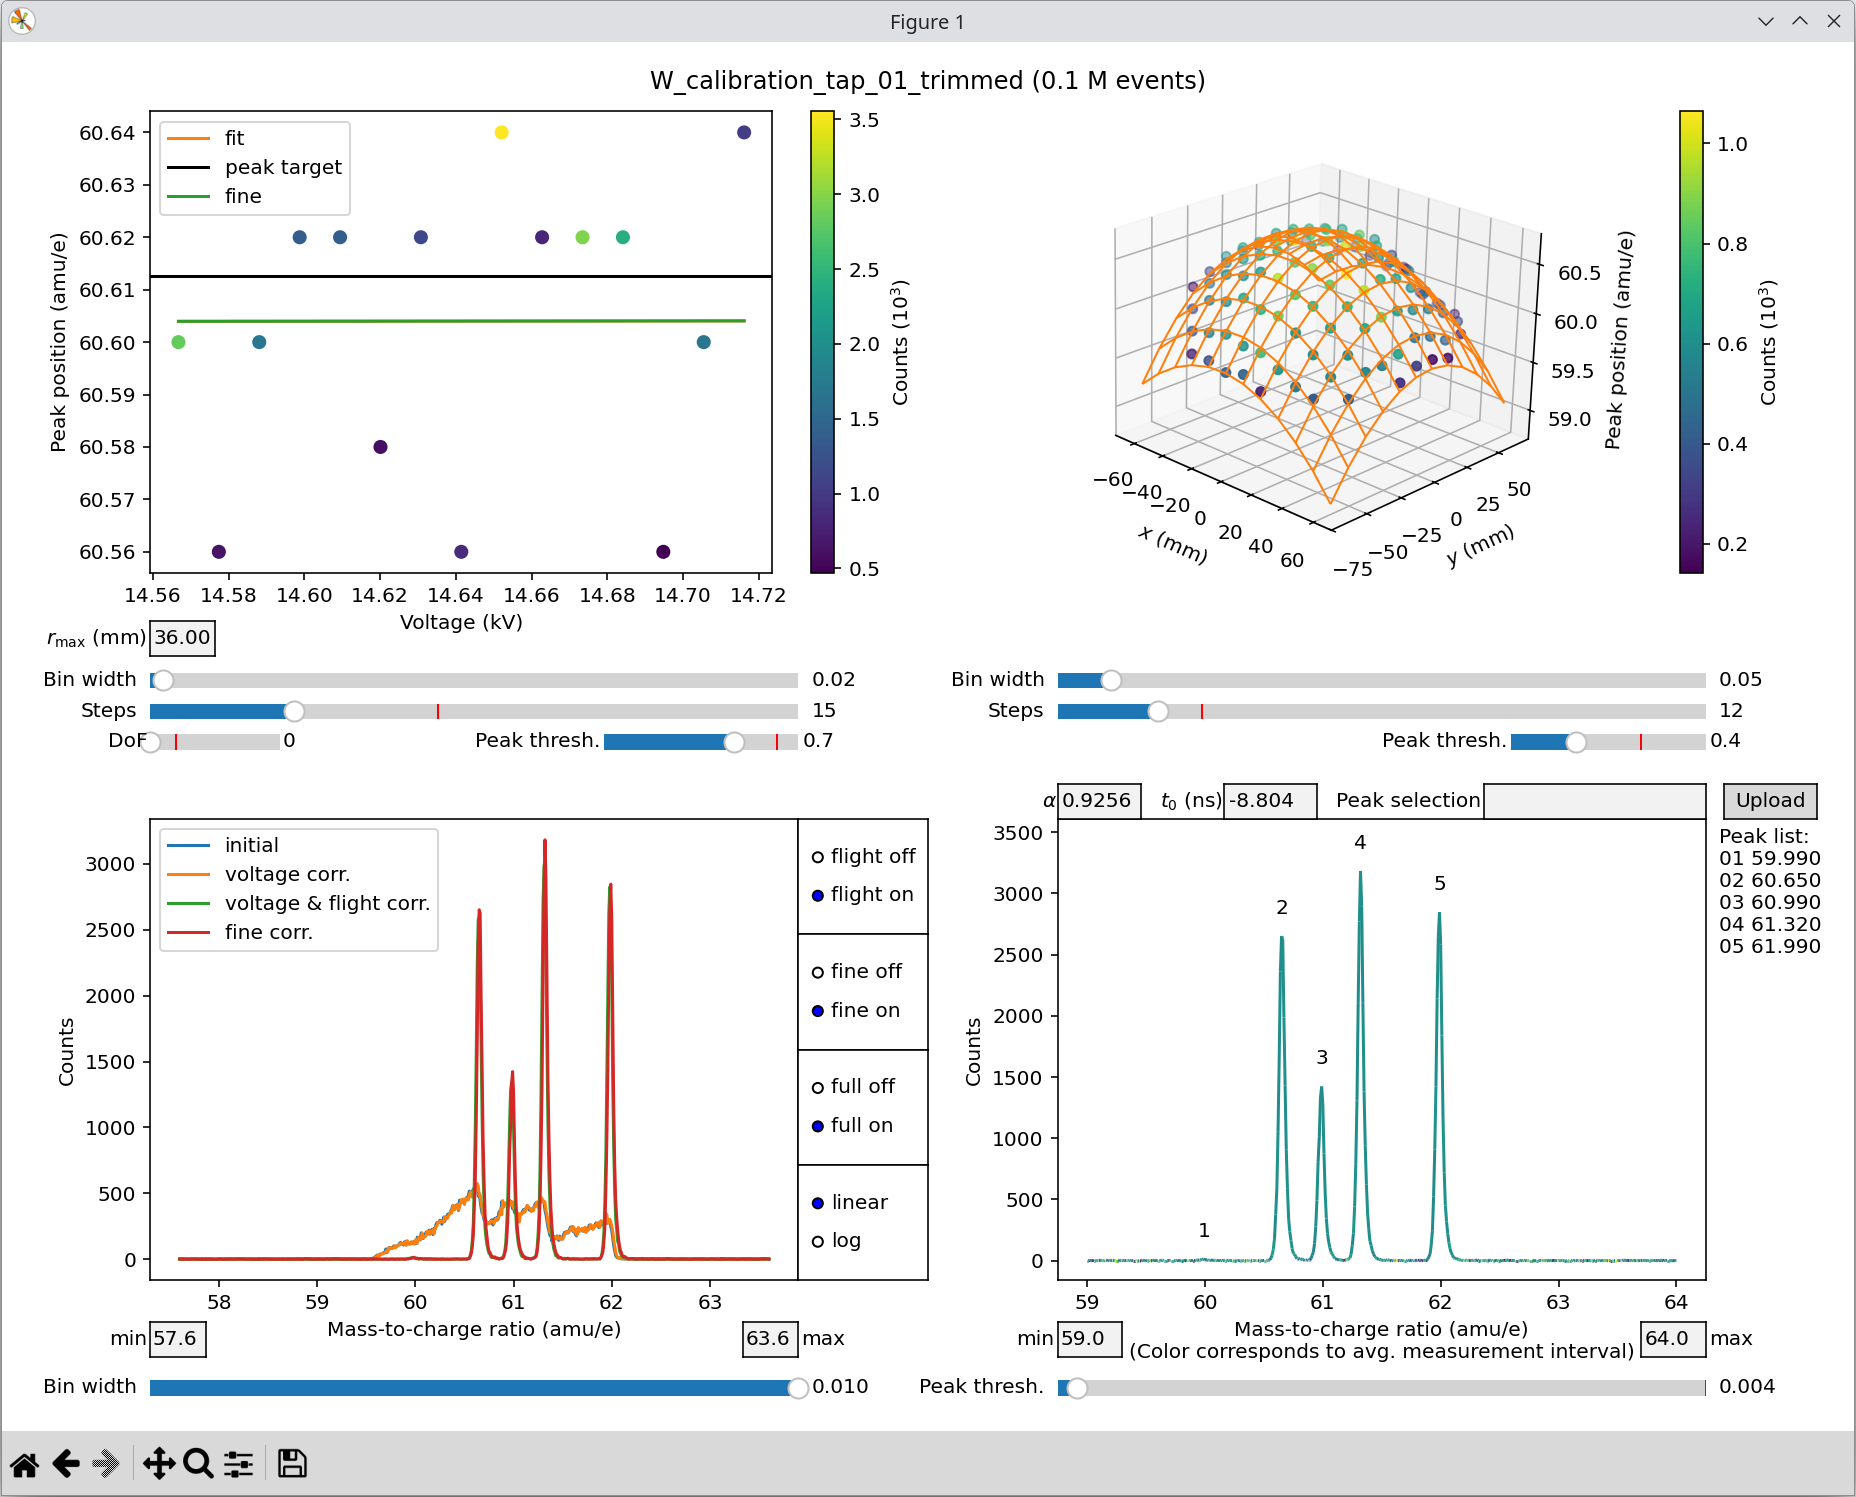
Spectrum alignment for the exemplary measurement.
Attention
Automatic peak alignment via the Peak selection field may not work reliably for such a small measurement. You may need to fine-tune the alignment by manually adjusting the \(\alpha\) and \(t_0\) fields.
Once this step is done, the local database file will be updated and should contain parameters similar to:
1:
  custom_id: W_calibration_tap_01_trimmed
  device: tap
  file: apyt_W_calibration_tap_01_trimmed.raw
  parameters:
    data_filter:
      detector_radius: 60.0
      mass_charge_range:
      - 59.0
      - 64.0
    spectrum_params:
      L_0: 305.0
      alpha: 0.925599992275238
      bin_width: 0.01
      detector_voltage: 0.0
      flight_coeffs:
      - - 1.0
        - 3.8777146983193234e-05
        - -3.1764066079631448e-06
      - - -6.607927207369357e-05
        - -1.7098403759518987e-07
        - 0.0
      - - -2.7257422061666148e-06
        - 0.0
        - 0.0
      pulse_coupling: 1.0
      t_0: -8.803999900817871
      voltage_coeffs:
      - 2.0708816051483154
You can then proceed with fitting of the mass spectrum:
apyt_spectrum_fit --no-sql 1 "{'W': ((3,), 0.0158)}"
and finally perform the reconstruction:
apyt_reconstruction --no-sql --module classic 1
Attention
Confirm updates to your database after every step if requested. Each subsequent step relies on the results of the preceding steps.
Hint
The small example dataset is a trimmed version of the dataset demonstrated in the command line interface. Parameters shown there are compatible with this smaller dataset.