The APyT mass spectrum alignment module
This module provides methods for the semi-automatic alignment of high-quality mass spectra from raw atom probe measurement data. It includes routines for correcting instrumental and geometric distortions to optimize peak sharpness in the mass-to-charge spectrum.
The resulting alignment parameters can be used in subsequent processing steps, such as analytical peak fitting or 3D reconstruction.
General function parameter description
Event data
Input data is expected as an ndarray of shape (n, 4) and data type float32, where each row represents one of the \(n\) measured events. The four columns must contain:
Measured voltage \(U\) (in V);
Detector hit positions \(x\), \(y\) (in mm);
Time-of-flight \(t\) (in ns).
(Refer to the raw file format for more details.)
Physical spectrum parameters
The mass-to-charge ratio is computed using the following expression:
where:
\(\varphi(U)\) — Voltage correction function;
\(t_0\) — Time-of-flight offset;
\(L_0\) — Nominal tip-to-detector distance;
\(\psi(x, y)\) — Flight length correction based on detector hit position;
\(\alpha\) — Scaling factor adjusting the voltage-to-distance ratio.
The corrections are defined as follows:
\(\varphi(U)\) and \(\psi(x, y)\) are represented by polynomial functions using polyval and polyval2d from NumPy.
The complete correction and alignment are specified by a tuple of parameters: (\(t_0\), \(L_0\), (voltage_coeffs, flight_coeffs), \(\alpha\)), where:
Coefficients are given as an ndarray (or None to disable correction);
All values must be of type float32.
Note:
The center of the detector is assumed to have no correction: \(\psi(0, 0) ≡ 1\).
The fix point of voltage correction, \(U_\textnormal{fix}\), is defined where \(\varphi(U_\textnormal{fix}) = 0\), as demonstrated in the following figure:
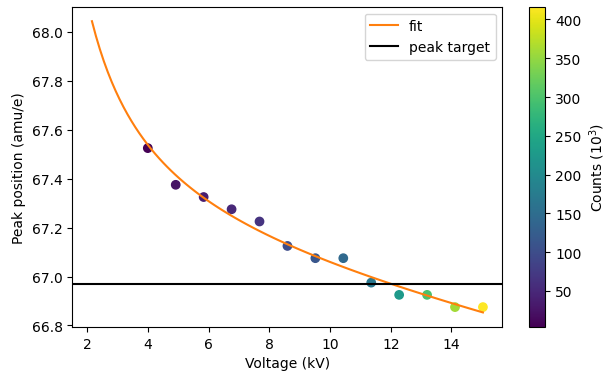
Example of a voltage correction curve. The fix point is the intersection of the peak-weighted average (black line) with the fit to the peak position data from voltage subranges (orange line). Here: \(U_\textnormal{fix} \approx 12\,\text{kV}\).
Because \(\alpha\) and \(t_0\) remain adjustable even after correction,
they are used in a final alignment step (see peak_align()).
Histogram parameters
The mass spectrum is generated using the numpy.histogram function. You may pass the following parameters via a dictionary:
range— Lower and upper bounds for histogram binning.width— Desired bin width (used to construct the bins). Defaults to 0.05 amu/e.
Automatic peak alignment
After voltage and flight path corrections have been applied to optimize peak sharpness, the spectrum must still be aligned to known peak positions.
This is achieved by automatically adjusting the two free parameters:
The scaling factor \(\alpha\);
The time offset \(t_0\).
Alignment is performed by selecting two prominent peaks and assigning them known target positions. These two known points are sufficient to determine the optimal values of \(\alpha\) and \(t_0\).
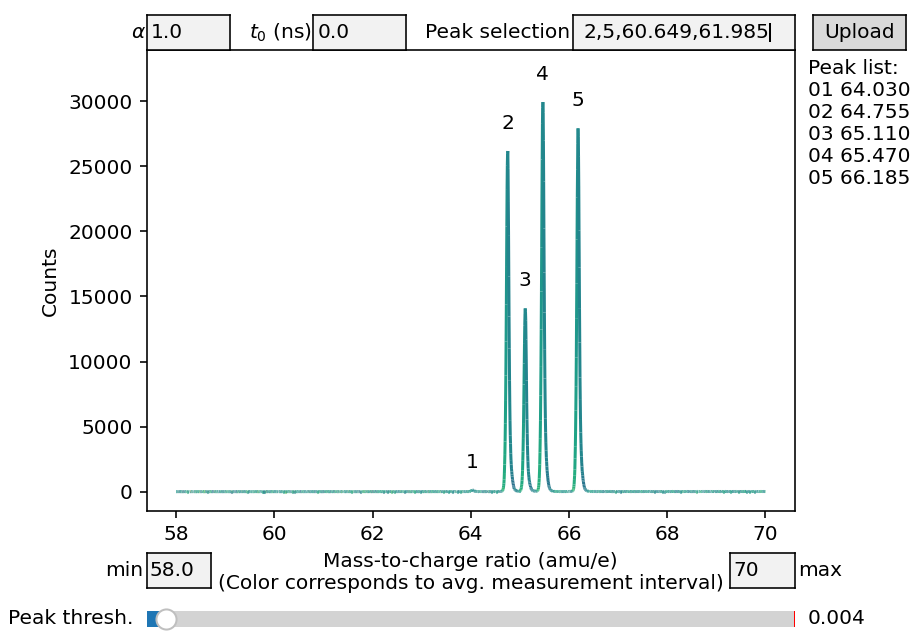
Peak selection for spectrum alignment.
After optimization, the resulting values are applied to finalize the spectrum:
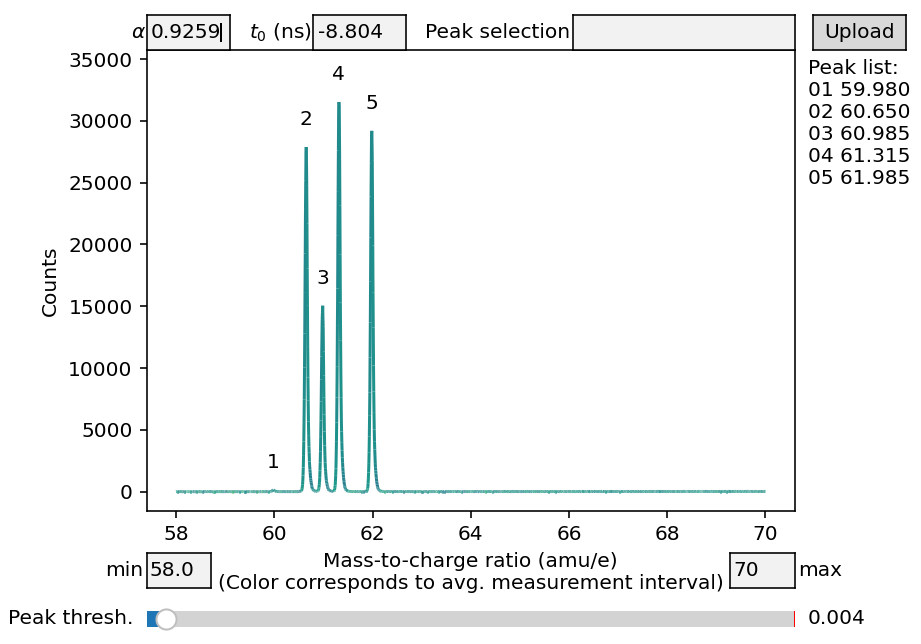
Final aligned spectrum with corrected peak positions.
List of functions
This module provides the following functions for spectrum correction and alignment:
enable_debug(): Enable or disable debug output.get_flight_correction(): Obtain coefficients for flight length correction.get_mass_spectrum(): Calculate mass spectrum.get_voltage_correction(): Obtain coefficients for voltage correction.optimize_correction(): Automatically optimize correction coefficients.peak_align(): Automatically align peak positions.
- apyt.spectrum.align.enable_debug(is_dbg)[source]
Enable or disable debug output.
- Parameters:
is_dbg (bool) – Whether to enable or disable debug output.
- apyt.spectrum.align.get_flight_correction(data, spec_par, **kwargs)[source]
Obtain coefficients for flight length correction.
In order to perform the flight length correction, the detector is first divided into a regular grid and for each of the corresponding detector segments, the position of the maximum peak is determined. By definition, the peak position in the very center of the detector is used as the peak target position for all detector segments. A 2d polynomial will then be used to map all determined peak positions to the peak target position, resulting in the flight length correction.
- Parameters:
data (ndarray, shape (n, 4)) – The n measured events, as described in event data.
spec_par (tuple) – The physical parameters used to calculate the mass-to-charge spectrum, as described in spectrum parameters.
- Keyword Arguments:
deg (int) – The degree of the polynomial used for correction. Defaults to
2.hist (dict) – The (optional) histogram parameters used to create the mass-to-charge histogram, as described in histogram parameters.
size (float) – The minimum required size to take a certain detector segment into account for correction. The size is given relative to the number of events which would be expected for a homogeneous distribution. This option effectively filters segments with a low number of events. Defaults to
0.3.steps (int) – The number of segments (for both \(x\)- and \(y\)-direction) into which the detector is divided. Defaults to
15.thres (float) – The threshold used to determine peaks (relative to the maximum peak). If multiple peaks of similar height fall into the correction window, different (maximum) peaks may be picked up for different detector segments. By reducing the threshold for the peak detection, all of these peaks with similar height will be picked up which are above the specified threshold. In order to ensure consistent evaluation, always the first of these peaks is then chosen for the correction. Defaults to
0.9.
- Returns:
coeffs (ndarray, shape (deg + 1,)) – The polynomial coefficients obtained for correction (of type float32).
(x, y, peak_pos) (tuple) – The tuple containing the data of the detected peak positions for every detector segment, each of type ndarray with shape (m,).
events (ndarray, shape (m,)) – The number of events in each detector segment. Can be used for color-coding.
wireframe (tuple) – The \((x, y, z)\) data needed to construct a wireframe, as obtained by the fit function. The result can be passed directly to the plot_wireframe() function from the matplotlib module.
- apyt.spectrum.align.get_mass_spectrum(data, spec_par, **kwargs)[source]
Calculate mass spectrum.
Calculate the mass-to-charge spectrum of the input data using the
numpy.histogram()function.- Parameters:
data (ndarray, shape (n, 4)) – The n measured events, as described in event data.
spec_par (tuple) – The physical parameters used to calculate the mass-to-charge spectrum, as described in spectrum parameters.
- Keyword Arguments:
hist (dict) – The (optional) histogram parameters used to create the mass-to-charge histogram, as described in histogram parameters.
- Returns:
hist (ndarray, shape (m,)) – The m histogram counts.
bin_centers (ndarray, shape (m,)) – The m bin centers of the histogram.
mc_ratio (ndarray, shape (n,)) – The n mass-to-charge ratios for each event.
- apyt.spectrum.align.get_voltage_correction(data, spec_par, **kwargs)[source]
Obtain coefficients for voltage correction.
In order to perform the voltage correction, the full voltage range is first divided into several (equidistant) subranges and for each of the corresponding ranges, the position of the maximum peak is determined. By definition, the weighted average (with respect to the number of events in the respective range) of all peak positions is used as the peak target position for all voltage ranges. A 1d polynomial will then be used to map all determined peak positions to the peak target position, resulting in the voltage correction.
- Parameters:
data (ndarray, shape (n, 4)) – The n measured events, as described in event data.
spec_par (tuple) – The physical parameters used to calculate the mass-to-charge spectrum, as described in:ref:spectrum parameters <apyt.spectrum.align:Physical spectrum parameters>.
- Keyword Arguments:
deg (int) – The degree of the polynomial used for correction. Defaults to
2.hist (dict) – The (optional) histogram parameters used to create the mass-to-charge histogram, as described in histogram parameters.
r_max (_np_float) – The optional radial range for filtering.
size (float) – The minimum required size to take a certain voltage range into account for correction. The size is given relative to the number of events which would be expected for a homogeneous distribution. This option effectively filters voltage ranges with a low number of events. Defaults to
0.3.steps (int) – The number of steps into which the full voltage range is divided. Defaults to
20.thres (float) – The threshold used to determine peaks (relative to the maximum peak). If multiple peaks of similar height fall into the correction window, different (maximum) peaks may be picked up for different voltage ranges. By reducing the threshold for the peak detection, all of these peaks with similar height will be picked up which are above the specified threshold. In order to ensure consistent evaluation, always the first of these peaks is then chosen for the correction. Defaults to
0.9.
- Returns:
coeffs (ndarray, shape (deg + 1,)) – The polynomial coefficients obtained for correction (of type float32).
(U, peak_pos) (tuple) – The tuple containing the data of the detected peak positions for every voltage range, each of type ndarray with shape (m,).
events (ndarray, shape (m,)) – The number of events in each voltage range. Can be used for color-coding.
fit_data (tuple) – Smooth data for the peak position in dependence on the voltage, as obtained by the fit function (each of type ndarray with shape (100,)).
- apyt.spectrum.align.optimize_correction(data, spec_par, mode, **kwargs)[source]
Automatically optimize correction coefficients.
This function can be used to fine-tune the coefficients used for the voltage and flight length correction, respectively. The coefficients are varied systematically (using the Nelder–Mead algorithm for the minimize() function from the scipy.optimize module) so that the width of the maximum peak in the spectrum reaches maximum possible sharpness.
- Parameters:
data (ndarray, shape (n, 4)) – The n measured events, as described in event data.
spec_par (tuple) – The physical parameters used to calculate the mass-to-charge spectrum, as described in:ref:spectrum parameters <apyt.spectrum.align:Physical spectrum parameters>.
mode (str) – The string indicating which coefficients shall be optimized. Must be either
voltageorflight.
- Keyword Arguments:
hist (dict) – The (optional) histogram parameters used to create the mass-to-charge histogram, as described in histogram parameters.
- Returns:
coeffs – The optimized polynomial coefficients (of type float32).
- Return type:
ndarray, shape of input array
- apyt.spectrum.align.peak_align(peaks_init, peaks_final, voltage_coeffs, L_0, alpha, U_guess=10000.0)[source]
Automatically align peak positions.
After the coefficients for the voltage and flight correction length have been determined in order to obtain sharp peaks, the mass spectrum still needs to be aligned properly. In principle, there are two parameters to be determined: The scaling factor \(\alpha\) of the voltage-to-flight length ratio and the time offset \(t_0\) (see spectrum parameters. These parameters can be obtained by solving
\[\frac m q = \alpha \left(\frac m q\right)_0 \left(1 - \frac{t_0}{L_0} \sqrt{\frac{2 U_\textnormal{fix}} {\left(\frac m q\right)_0} }\right)^2\]for two known peaks, where \(\left(\frac m q\right)_0\) and \(\frac m q\) are the initial and peak target position, respectively, and \(U_\textnormal{fix}\) is the voltage fix point at which no voltage correction is applied by definition.
- Parameters:
peaks_init (ndarray, shape (2,)) – The two initial peak positions (amu/e) before alignment.
peaks_final (ndarray, shape (2,)) – The two final peak target positions (amu/e) after alignment.
voltage_coeffs (ndarray, shape(n,)) – The voltage correction coefficients, as described in spectrum parameters.
L_0 (_np_float) – The nominal flight length.
alpha (_np_float) – The current constant spectrum scaling factor, as described in spectrum parameters. Required for iterative calls of this function if the current value is not equal to unity.
U_guess (float, optional) – The initial guess for the voltage fix point (i.e. the voltage at which no correction is applied by definition). Defaults to 10 kV.
- Returns:
params – The coefficients \((t_0, \alpha)\) for the peak alignment.
- Return type:
ndarray, shape (2,)